Monday, December 31, 2012

Excel and AutoCAD LT diesel macro...

Last week I had a question posed to me about linking an excel document to Autocad and then having a diesel macro that establishes a user variable and then returns that value to the excel document which in turn returns another variable to Autocad for labeling functionality.  For instance if you were assigning names to office spaces and you had them all in an excel document.  You could create a vlookup function in a cell, and have the cell that autocad will return a value to as the one that the vlookup is looking at to return your name. 

The diesel macro establishes a user variable is the indexing number and another one as the incrementing number.  Each time you use the command it will update one table which in turn updates the excel document and returns you the name that is associated with that number.

Is there anyone that has needed this function or any one who would like to have this function?  If so, keep reading this post.

Alrighty…the instructions to automating (fingers crossed) the names being inserted by table and then exploded.
First up…creating a new table style:

In the command line type: tables  

Then hit enter.

The following dialog box should come up.

Once you click the “New…” button enter whatever name you want to name it.
In the next dialog box follow as shown in pic below


In the borders tab change the border to be “No Border”
Then hit okay.
Once done you will go back to the main dialog for the table styles.
Make sure that the current style set is the one that you just created.

Now comes is the fun part…
First…lets create a table that is (1) column x (1) row. And then insert that into your drawing.
Now pick on that table and highlight cell “A1”…
Then on the ribbon panel you will see a button that says field…click that button. 


Then in the field dialog change your “Field category:” to show “Other”.
In the “Field names:” column pick “DieselExpression”.
And then in the box to the right enter the diesel expression that is shown.
See pic below on next page for clarification…
Once the expression is entered then click the okay button to get out of the dialog box.  And then escape out of your table.  If done right then the value in the cell should look like what is in the above picture…gray with white text.

Next is some of the tricky stuff.
Pick the table that you just created
And click on the link cell button as shown in picture below.

Then follow the steps that are shown below in pictures.


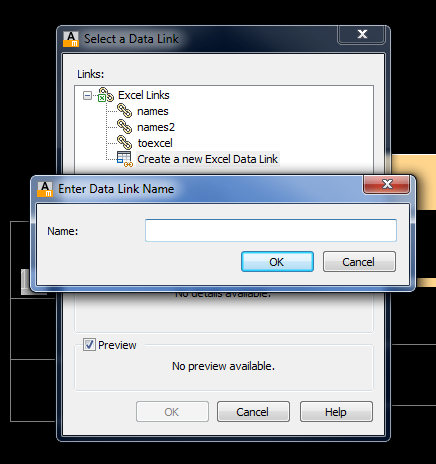
Here is where you will select the excel file with the names that you are going to be generating in your cad file.

Be sure to select the “link to range” button and then put a random cell in there that you can remember for later when you have to get into your excel doc and create a vlookup value.

p.s. you have to do at least a 2 cell range or it won’t take it.  Also, make the sheet a different one from where the names are as well.

Now…we need to get into the excel file, and I am kind of hoping that you have the names numbered 1-300 or something because it will make it a lot easier, but if you have a different case of associating a number to names then leave a comment about what you are needing and I will see what I can do to help remedy the issue.
In the excel doc…on the sheet with the names; off to the right of those columns pick an empty cell and create a vlookup…the “Sheet?!A!” is referring to whatever sheet and cell you linked the table to that you have already created.

=vlookup(Sheet?!A1,A1:b300,2)

Make sure you save the excel doc and then close it…
Next…
We are going to go through the creating the datalink to the same excel doc but this time the linked range is going to be the one that is going to show the name in it.
When creating this datalink…I would recommend naming it “names2” just because that name is already built into the macro.
Now once you have that done you are basically ready to create the button with the macro…
Below is the macro for the button…

*^C^Cupdatefield;all;;tabledit;\;datalinkupdate;w;all;;-table;l;names2;\explode;$m=$(getvar,lastpoint);setvar;userr1;$m=$(+,$(getvar,userr1),$(getvar,userr2))

It is amazing how short it is, and yet there is so much work prior to being able to use it.
When you run the macro the first thing it will do is prompt you to pick a table…and you will pick the initial table that you built that has the updating variable number.  Once you pick it then the next thing you do is place the name.
Once you place it you will notice that it has borders…and that is because it is inserted as a block and then explode in the macro.  The border lines won’t print out on your drawing.
Again, we are using userr1, and userr2; so userr2 always stays as a value of 1.
Okay…I think that is it…at least I hope that is it.
Let me know if there is anything else that you need clarified and I will do my best to help clarify things.

Thursday, December 20, 2012

Instrumentation symbols with automated numbers...(diesel macro)

Working in the Process and Mechanical field you come across a lot of things that need to be automated so that it makes things a little easier on you as a designer.  So, one of the latest Diesel macros that I wrote is for automated ISA Instrumentation symbols.  The good thing is that this code can be used to create user commands for all instrumentation symbols and it will flow seamlessly with each symbol placed. 

Okay, now to the code...

*^c^c$M=$(+,$(getvar,USERR1),$(getvar,USERR2));setvar;USERR1;
$M=$(+,$(getvar,USERR1),$(getvar,USERR2));-insert;
DISCRETE-PRIMARY;\1;1;\$(GETVAR,USERR1);LIT;;;

The first portion of the code prior to the insert command is doing the math to increment the variables in the symbol.  In this example you can see that we are using USERR1 & USERR2; where USERR1 is the initial number that you want to use, and then USERR2 is the variable that increases the value of USERR1. 

The coding for the insert command may vary, but for mine after I call the symbol name I have a \1;1;\.  This is the order of that bit of code...insertion point, scale x-coordinate, scale y-coordinate, rotation.

Once you go through that then the first attribute that is being filled in is the number; so, we tell it to get the USERR1 variable, and then the next one you can leave it as a user input by substituting "LIT" with "\".  Then depending on how many other attributes you have attached to the symbol you will need a semicolon for each attribute after the "LIT" for it to be able to repeat the command properly.

Wednesday, December 5, 2012

Printing DataGridView's in VB...

Lately I have been writing a lot of selection and list programs, and one that I have written was for engineers to list out valves, control valves, and equipment for projects to be able to send them out for quoting and design purposes.  One issue that I ran into was being able to get the DataGridView to print each line that is entered into the grid.  But, I was able to find a bit of code and with a few modifications of my own...I was able to get it to print all lines entered into the grid, and also allow the programmer to change location of the grid on the printdocument file.
So, below is the code for the datagridview:
 
Dim mRow As Integer = 0
Dim newpage As Boolean = True
Private Sub PrintDocument1_PrintPage(sender As System.Object, e As System.Drawing.Printing.PrintPageEventArgs) Handles PrintDocument1.PrintPage
Dim tmpSize As New SizeF()
Dim tmpFont As Font
For i As Integer = 0 To DataGridView1.Columns.Count()
tmpFont = DataGridView1.ColumnHeadersDefaultCellStyle.Font
If tmpFont Is Nothing Then
tmpFont = DataGridView1.DefaultCellStyle.Font
End If
For j As Integer = 0 To DataGridView1.Rows.Count - 1
tmpFont = DataGridView1.Rows(j).DefaultCellStyle.Font
If tmpFont Is Nothing Then
tmpFont = DataGridView1.DefaultCellStyle.Font
End If
Next
Next
Dim cellsPerRow As New List(Of Integer)
Dim rowHeight As Integer = DataGridView1.ColumnHeadersHeight + DataGridView1.Rows(0).Height
Dim cellWidths(DataGridView1.Columns.Count - 1) As Integer
Dim rowWidths As New List(Of Integer)
Dim cellCounter As Integer = 0
With DataGridView1
Dim fmt As StringFormat = New StringFormat(StringFormatFlags.LineLimit)
fmt.LineAlignment =
StringAlignment.Center fmt.Trimming =
StringTrimming.EllipsisCharacter Dim y As Single = e.MarginBounds.Top + 120
Do While mRow < .RowCount
Dim row As DataGridViewRow = .Rows(mRow)
Dim x As Single = e.MarginBounds.Left
Dim h As Single = 0
For Each cell As DataGridViewCell In row.Cells
Dim rc As RectangleF = New RectangleF(x, y, cell.Size.Width, cell.Size.Height)
e.Graphics.DrawRectangle(Pens.Black, rc.Left, rc.Top, rc.Width, rc.Height)
If (newpage) Then
e.Graphics.DrawString(DataGridView1.Columns(cell.ColumnIndex).HeaderText, .Font,
Brushes.Black, rc, fmt)
Else
e.Graphics.DrawString(DataGridView1.Rows(cell.RowIndex - 1).Cells(cell.ColumnIndex).FormattedValue.ToString(), .Font, Brushes.Black, rc, fmt)
End If
x += rc.Width
h =
Math.Max(h, rc.Height) Next
newpage =
False y += h
mRow += 1
If y + h > e.MarginBounds.Bottom Then
e.HasMorePages =
True mRow -= 1
newpage =
True Exit Sub
End If
Loop
mRow = 0
End With
End Sub

So, the bit of code that is highlighted in yellow is where you can control the vertical location of the grid on the printdocument.  Also if you want to change the location of the grid horizontally then; three lines below "dim y" there is the code line for the "dim x as single" you can change the value of that to change the horizontal location of the grid.

Happy Coding!